Do you run ping tool very often? Do you find yourself squeezing your eyes to see if a packet has been lost? Do you want to have a better view of the latency and of the lost packets over time?
Then prettyping is the tool for you!
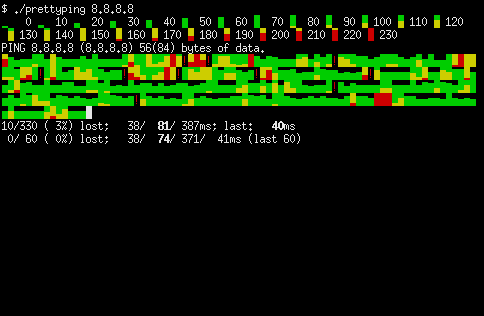
prettyping runs the standard ping in background and parses its output, showing ping responses in a graphical way at the terminal (by using colors and Unicode characters). Don’t have support for UTF-8 in your terminal? No problem, you can disable it and use standard ASCII characters instead. Don’t have support for colors? No problem, you can also disable them.
prettyping is written in bash and awk, and should work out-of-the-box in most systems (Linux, BSD, Mac OS X, …). It is self-contained in only one file, so it is trivial to install and run.
Quick install and run
curl -O https://raw.githubusercontent.com/denilsonsa/prettyping/master/prettyping
chmod +x prettyping
./prettyping whatever.host.you.want.to.ping
Check out the prettyping repository on GitHub.
Features
- Detects missing/lost packets and marks them at the output.
- Shows live statistics, updated after each response is received.
- Two sets of statistics are calculated: one for the most recent 60 responses, and another for all responses since the start of the script.
- Correctly handles “unknown” lines, such as error messages, without messing up the output.
- Detects repeated messages and avoids printing them repeatedly.
- Fast startup, very few and lightweight dependencies.
- No installation required, just run the script from anywhere (and make sure you have the 3 dependencies, most Linux distros already have them).
- Sane defaults, auto-detects terminal width, auto-detects if the output is a terminal. Basically, just run the script and don’t worry about the options until you need to.
- Options not recognized by prettyping are passed to the ping tool. As a wrapper, you can use the most common ping parameters in prettyping as well.
- As a wrapper, it can run as normal user. Root access is NOT required.
- The output can be redirected to a file (using shell redirection or pipeline). In such mode, prettyping will avoid using cursor-control escape codes.
- Colorful output (can be disabled by command-line option).
- Graphical output of the latency using unicode characters (can be disabled by command-line option).
- Intuitive, easy-to-read output.
- It looks pretty!
What does it look like?
Screenshot:

Animated GIF (sped up to 4×) showing what prettyping can do:

YouTube demonstration by Yu-Jie Lin:
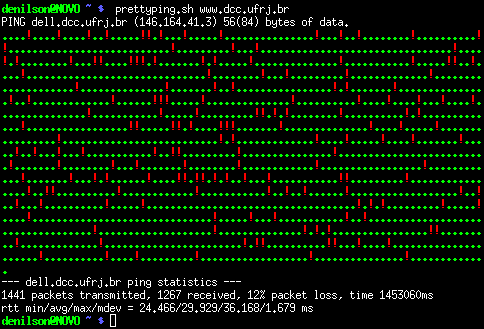
Very old screenshot, showing how prettyping looked like in 2008:

Comparison between tools
| ping | mtr | oping | prettyping | |
|---|---|---|---|---|
| Programming language | C | C | C | bash and awk |
| How easy to install from scratch? | Should already come with your system | Medium (C compiler + root privileges) | Medium (C compiler + ncurses + root privileges) | Trivial (just one file) |
| Requires root to install? | Yes (suid) | Yes (suid) | Yes (suid) | No (wrapper for ping, which is suid) |
| How many hosts? | One | All hosts in path | One or more | One |
| Minimum ping interval | 0.2s for non-root users | 1.0s for non-root users | 0.001s | The same as ping or oping |
| How easy to read the latency? | Precise individual values are printed, average is only printed upon exit | Statistics for each host are updated on each response, plus a non-intuitive legend for the graph | oping: Looks the same as pingnoping: Enhances the normal output with colors and live statistics and prettyping-inspired graphics |
Statistics for each host are updated on each response, plus an intuitive and colorful graph |
| How easy to see lost packets? | Hard (lost packages aren’t printed on the Linux ping) |
Easy (? at the graphic, plus listed in the statistics) |
Very easy (oping prints missing responses, noping additionally shows them in the graph) |
Very easy (red ! at the graphic, plus listed in the statistics) |
| Statistics | Only shown upon exit | Updated in real-time, considers all responses since the beginning of the run | oping: Only shown upon exitnoping: Updated in real-time, considers all responses since the beginning of the run |
Updated in real-time, shows statistics for all responses since the beginning of the run, as well as statistics for the most recent 60 responses |
| Can redirect output to file? | Yes | No | oping: Yesnoping: No |
Yes |
| Terminal behavior | Standard output | Curses full-screen app | oping: Standard outputnoping: Curses full-screen app |
Standard output with optional colors and VT100 escapes |
| Terminal dimensions | Ignores the terminal size | Reacts immediately to the terminal size | oping: Ignores the terminal sizenoping: Adapts to the terminal size |
Adapts to the terminal size (only the future responses, the past responses are not changed) |
FAQ and troubleshooting
I don’t see the block characters, all I see are weird characters such as “â..”.
Your terminal does not seem to support UTF-8. Configure your terminal correctly, switch to another terminal, or just use the --nounicode option. Also, do not copy-paste the code from the browser, download it instead.
What if I am using PuTTY?
Inside Window → Translation, set the remote character set to UTF-8 (as in this screenshot by battery_go user on reddit).
A bit of history
prettyping was originally written in January of 2008, while I was working at Vialink. I noticed that, very often, we were looking at the output of the ping tool to measure the quality of network links, by looking at a combination of packet loss ratio and latency. However, the standard ping output is too verbose, making it hard to have a quick glance at latency. Not just that, but missing/lost packets are not reported at all. Finally, the statistics of the run are only printed at the very end, after ping finishes running. This helpful piece of information should be available all the time.
I observed a common use-case, a common pattern in our daily work, and I noticed that our workflow could have been improved by having better tools. And so I built a better tool. (By the way, this paragraph describes something I do ALL the time.)
Thus prettyping was born. And it received essentially no updates after 2008.
In October 2013, I discovered the spark shell script in github, which made me want to implement a similar output in prettyping. After a few days, I had implemented many features I wanted to implement for a long time, in addition to the spark-like output. After finishing all these features and polishing them, I submitted this tool to reddit /r/linux and to /r/commandline and received a lot of positive feedback.
Afterwards, it was fixed to works on multiple awk implementations, to work on Mac OS X (in addition to Linux). People have even made packages for some Linux distros and for Mac OS X brew.
In April 2015, this tool got its own repository on GitHub (it was previously on small_scripts repository on GitHub).
In October 2015, someone else submitted this tool to Hacker News, and it managed to get to the front page!
Other interesting projects
- mtr - Combines the functionality of the
tracerouteandping, shows responses for all hosts in the path. - oping -
libopingis a C library to generate ICMP echo requests;opingis a tool that behaves just like the standardping, but detects and prints missing responses, and also allows pinging multiple hosts simultaneously;nopingis a tool with ncurses interface with the same features asoping, but also highlighting the rtt value and showing live statistics. Since late 2014, it includesprettyping-inspired graphical output. - spark - Draws graphs in the shell using Unicode characters.
